clover facilitates analysis and visualization of nanopore tRNA sequencing data, including differential expression, base-calling error analysis, and modification co-occurrence networks.
🚧🚧 clover is under active development. Caveat emptor. 🚧🚧
Installation
You can install the development version of clover from GitHub with:
# install.packages("pak")
pak::pak("rnabioco/clover")
Example
clover reads output from the aa-tRNA-seq-pipeline and stores the results in a SummarizedExperiment.
library(clover)
library(SummarizedExperiment)

# Load pipeline results into a SummarizedExperiment
se <- create_clover(
  config_path = clover_example("ecoli/config.yaml"),
  sample_info = data.frame(
    sample_id = c(
      "wt-15-ctl-01",
      "wt-15-ctl-02",
      "wt-15-ctl-03",
      "wt-15-inf-01",
      "wt-15-inf-02",
      "wt-15-inf-03"
    ),
    condition = rep(c("control", "infected"), each = 3)
  )
)

# Differential tRNA abundance with DESeq2
dds <- run_deseq(
  assay(se, "counts"),
  colData(se),
  design = ~condition
)

res <- tidy_deseq_results(
  dds,
  contrast = c("condition", "infected", "control")
)

plot_volcano(res)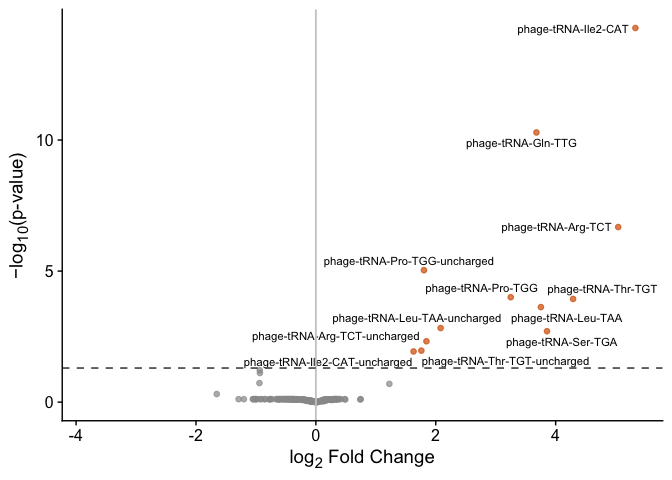
See vignette("clover") for a complete walkthrough.
Related work
- aa-tRNA-seq-pipeline is the Snakemake pipeline that generates the data clover analyzes.
- R2easyR visualizes structure probing signals on RNA secondary structure diagrams.
- nanoblot facilitates visualization of nanopore sequencing data, including a “virtual gel” plot.